Losing streak probability: 8 losses in a row is 49%
19 October 2026 · 4 min read · St. Joseph Desk
49.2%chance of 8 losses in a row within 180 trades at 45% wins
4losses in a row breach the max loss at 2.5% risk: over 99.9%
0.73%Risk 0.73% per trade: 14 losses breach a 10% max loss, 1.7% chance
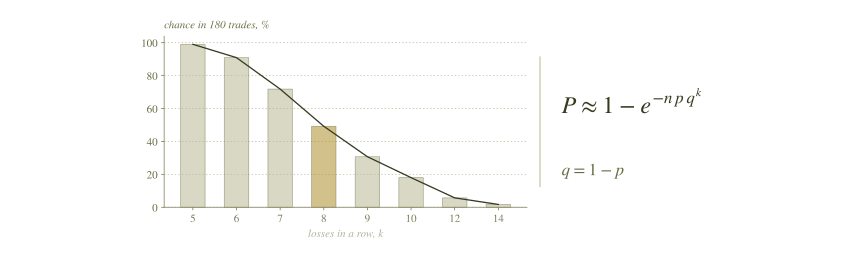
A few losses in a row and you wonder whether the setup broke. Any win rate below 100% produces losing streaks over enough trades, and 8 in a row is a coin flip over 180 trades at 45%.
Losing streak probability: the formula
- P
- chance of at least one streak of that length
- n
- number of trades
- p
- win rate, as a decimal
- q
- loss rate, which is 1 minus the win rate
- k
- losses in a row you are asking about
Each win is a possible start of a streak, and the chance that k losses follow shrinks fast as k grows. The formula multiplies the two (e ≈ 2.718).
How many losses in a row in 180 trades: worked example
- Loss rate:
- Chance that 8 losses in a row follow a given win:
- Scale by trades and wins:
- Chance of a streak:
The exact method gives 49.2%, the formula gives 49.2% and the simulation gives 48.5%.
Losing streak probability by streak length
| Losses in a row | Exact chance | Simulation |
|---|---|---|
| 5 | 99% | 98.9% |
| 6 | 90.9% | 91.2% |
| 7 | 71.8% | 71.6% |
| 8 | 49.2% | 48.5% |
| 9 | 30.7% | 30.1% |
| 10 | 18% | 17.3% |
| 12 | 5.7% | 5.5% |
| 14 | 1.7% | 1.6% |
How we calculated this: exact dynamic programming over the current losing run, 45% win rate, 180 trades (3 a day for 60 days), independent trades; Risk Sim check with 20000 paths, seed 7. The formula landed within 1.5 points of exact and the simulation within 0.7.
What a losing streak means for your size
Take a $6,000 account with a 10% max loss, so $600 of room. Pick the risk where the streak that breaches it is rare.
| Risk per trade | Losses to breach | Chance in 180 trades |
|---|---|---|
| $44 (0.73%) | 14 | 1.7% |
| $60 (1%) | 10 | 18% |
| $90 (1.5%) | 7 | 71.8% |
| $150 (2.5%) | 4 | more than 99.9% |
Dollar risk and room scale together with account size, so the loss counts and chances stay the same on a bigger or smaller account.
Convert the dollar risk to lots with the position size calculator. For what happens when size is wrong, read how challenges are lost on size.
What the model ignores
- Win rates drift; a bad month can run below 45%.
- Losses can cluster, so trades may not be fully independent.
- Slippage and news gaps make some losses larger than the stop.
- A daily loss limit can end the account before the total room does.
Questions traders ask
What if my win rate is higher than 45%?
The streak chance falls fast. Over 180 trades, 8 losses in a row has an 88.5% chance at a 35% win rate, 15% at 55% and 2.5% at 65%.
How many losses in a row over 500 trades?
Longer samples make long streaks likely. Over 500 trades at a 45% win rate, 6 in a row is 99.9%, 8 in a row is 85.4% and 10 in a row is 43.3%.
What is the longest losing streak to expect in 180 trades?
The median longest run is 7 losses. The 90th percentile is 11 by the exact method and 10 in the simulation.
Does a losing streak make a win more likely next?
No. The model treats each trade as independent, so a streak does not change the odds of the next trade. It only shows how often runs happen by chance.
Enter your own win rate and limits in the prop firm challenge calculator and get the daily sizing note in the free morning letter.
Not financial advice · general commentary, the same for every reader · simulated results, not a prediction.
Tomorrow's levels and size, before the open.
No signals, no upsell. One-click unsubscribe. Privacy